Getting Started with Xdebug
This guide shows you how to enable Xdebug in WordPress Playground and start debugging your code.
PHP WASM CLI vs Playground CLI
First, Xdebug is present in two different CLIs:
@php-wasm/cli: Run standalone PHP scripts. Use this when debugging PHP code without needing a WordPress environment.@wp-playground/cli: Run a full WordPress installation. Useful for debugging WordPress plugins, themes, or core functionality.
For this guide, we'll use @wp-playground/cli. If you're not familiar with the tool, we recommend reading the @wp-playground/cli guide, but the same process can also be applied to debugging PHP applications with @php-wasm/cli.
Quick start with npx
The fastest way to get started is using npx, which doesn't require installation:
npx @wp-playground/cli@latest server --xdebug
This starts WordPress on http://127.0.0.1:9400 with Xdebug enabled. Now you can connect a debugger.
Only one project can be debugged at a time.
Starting with IDE integration
Similar to the process with DevTools, let's use the same plugin code from before to debug with VS Code, and add the --experimental-unsafe-ide-integration=vscode flag. This flag will optimize the setup process for VS Code. If you're working with PhpStorm, add the --experimental-unsafe-ide-integration=phpstorm flag.
This flag is marked as unsafe because it edits the IDE config files to set Xdebug path mappings and web server details. CAUTION: If there are bugs, this feature may cause your IDE configuration files to break. Please consider backing up your IDE configs before using this feature.
To debug in VS Code, you'll need the following prerequisites:
- An extension to add PHP profiling support, for example, PHP Debug or another debugger extension to your preference.
- Have a
.vscode/folder. - Enable breakpoints in your IDE. Some IDEs come with this feature disabled, so be aware of this detail.
If everything is ready, you run the command:
npx @wp-playground/cli@latest server --xdebug --experimental-unsafe-ide-integration=vscode --auto-mount
If you don't have a .vscode/launch.json file, the terminal will create a file similar to this:
{
    "configurations": [
        {
            "name": "WP Playground CLI - Listen for Xdebug",
            "type": "php",
            "request": "launch",
            "port": 9003,
            "pathMappings": {
                "/": "${workspaceFolder}/.playground-xdebug-root",
                "/wordpress/wp-content/plugins/test-xdebug": "${workspaceFolder}/"
            }
        }
    ]
}
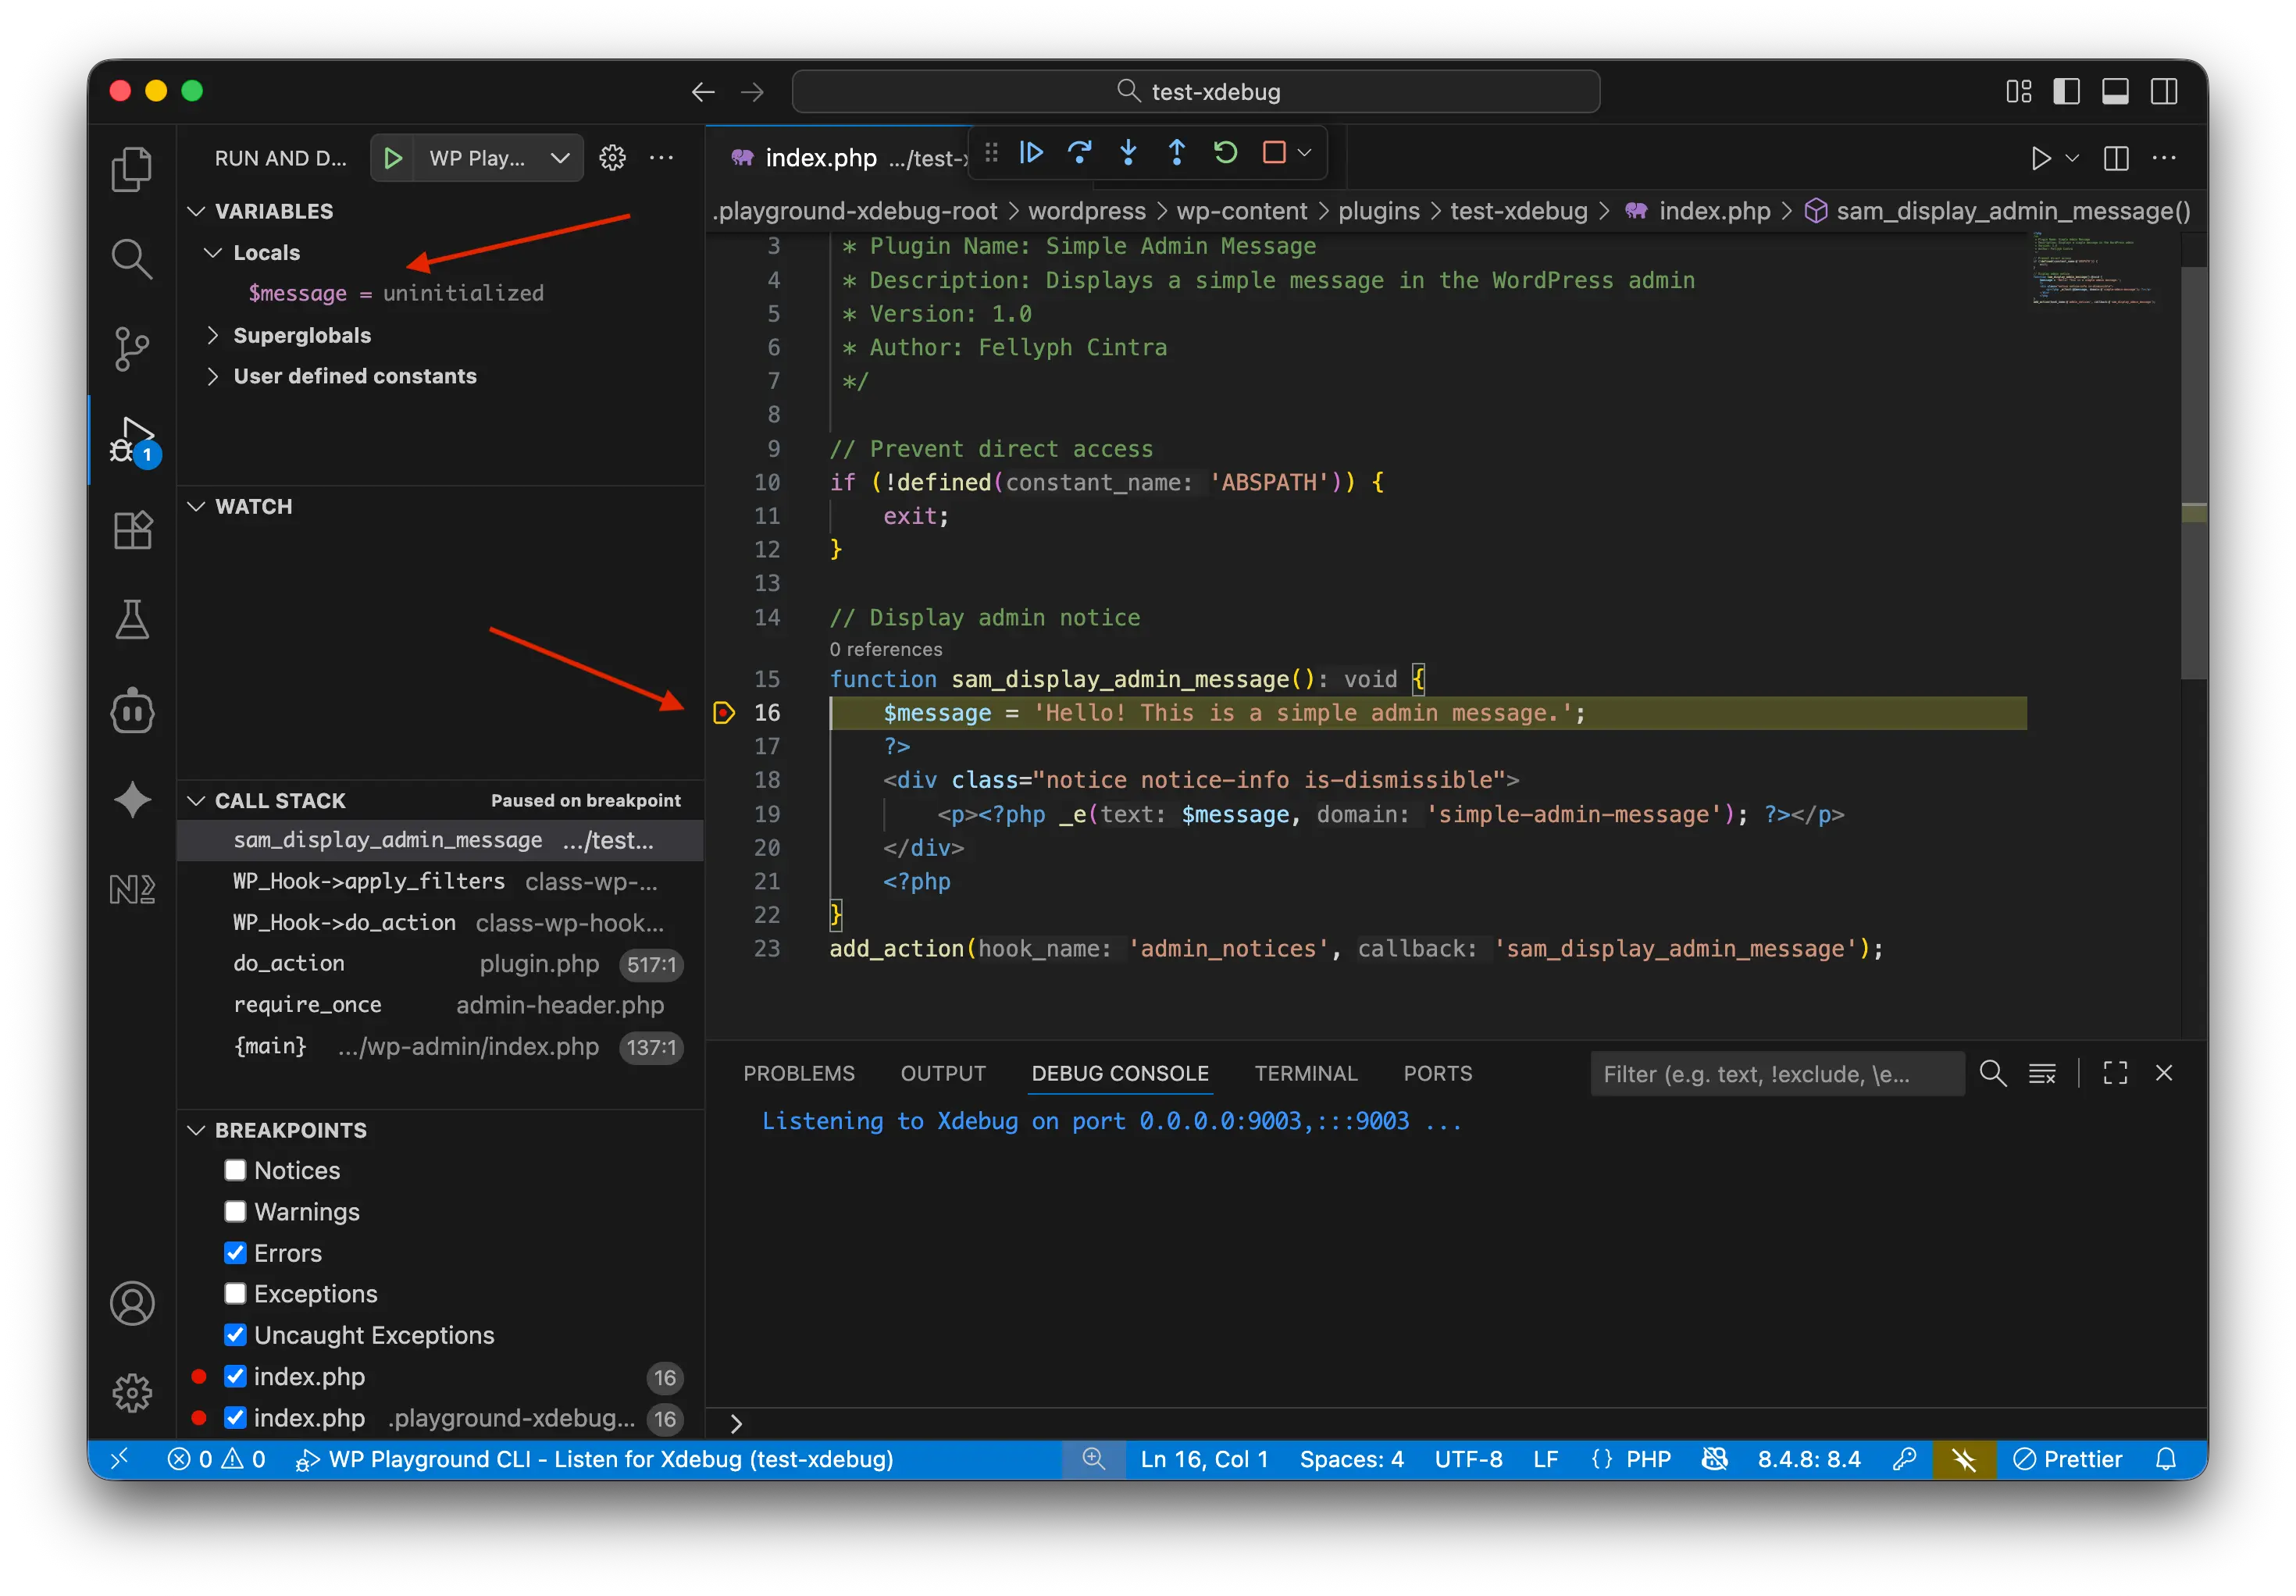
Now, you can go to your code, add the breakpoints, start the debugging session named by your IDE, and happy testing.
Early Access: DevTools debugger
Playground CLI ships an unstable, highly exploratory workflow that enables debugging PHP programs using Chrome DevTools.
To try it, use the --experimental-devtools flag:
npx @wp-playground/cli@latest server --xdebug --experimental-devtools
The terminal will display a URL to connect to Chrome DevTools:
Starting a PHP server...
Setting up WordPress latest
Resolved WordPress release URL: https://downloads.w.org/release/wordpress-6.8.3.zip
Fetching SQLite integration plugin...
Booting WordPress...
WordPress is running on http://127.0.0.1:9400 with 1 worker(s)
Starting XDebug Bridge...
Connect Chrome DevTools to CDP at:
devtools://devtools/bundled/inspector.html?ws=127.0.0.1:9229

Chrome connected! Initializing Xdebug receiver...
XDebug receiver running on port 9003
Running a PHP script with Xdebug enabled...
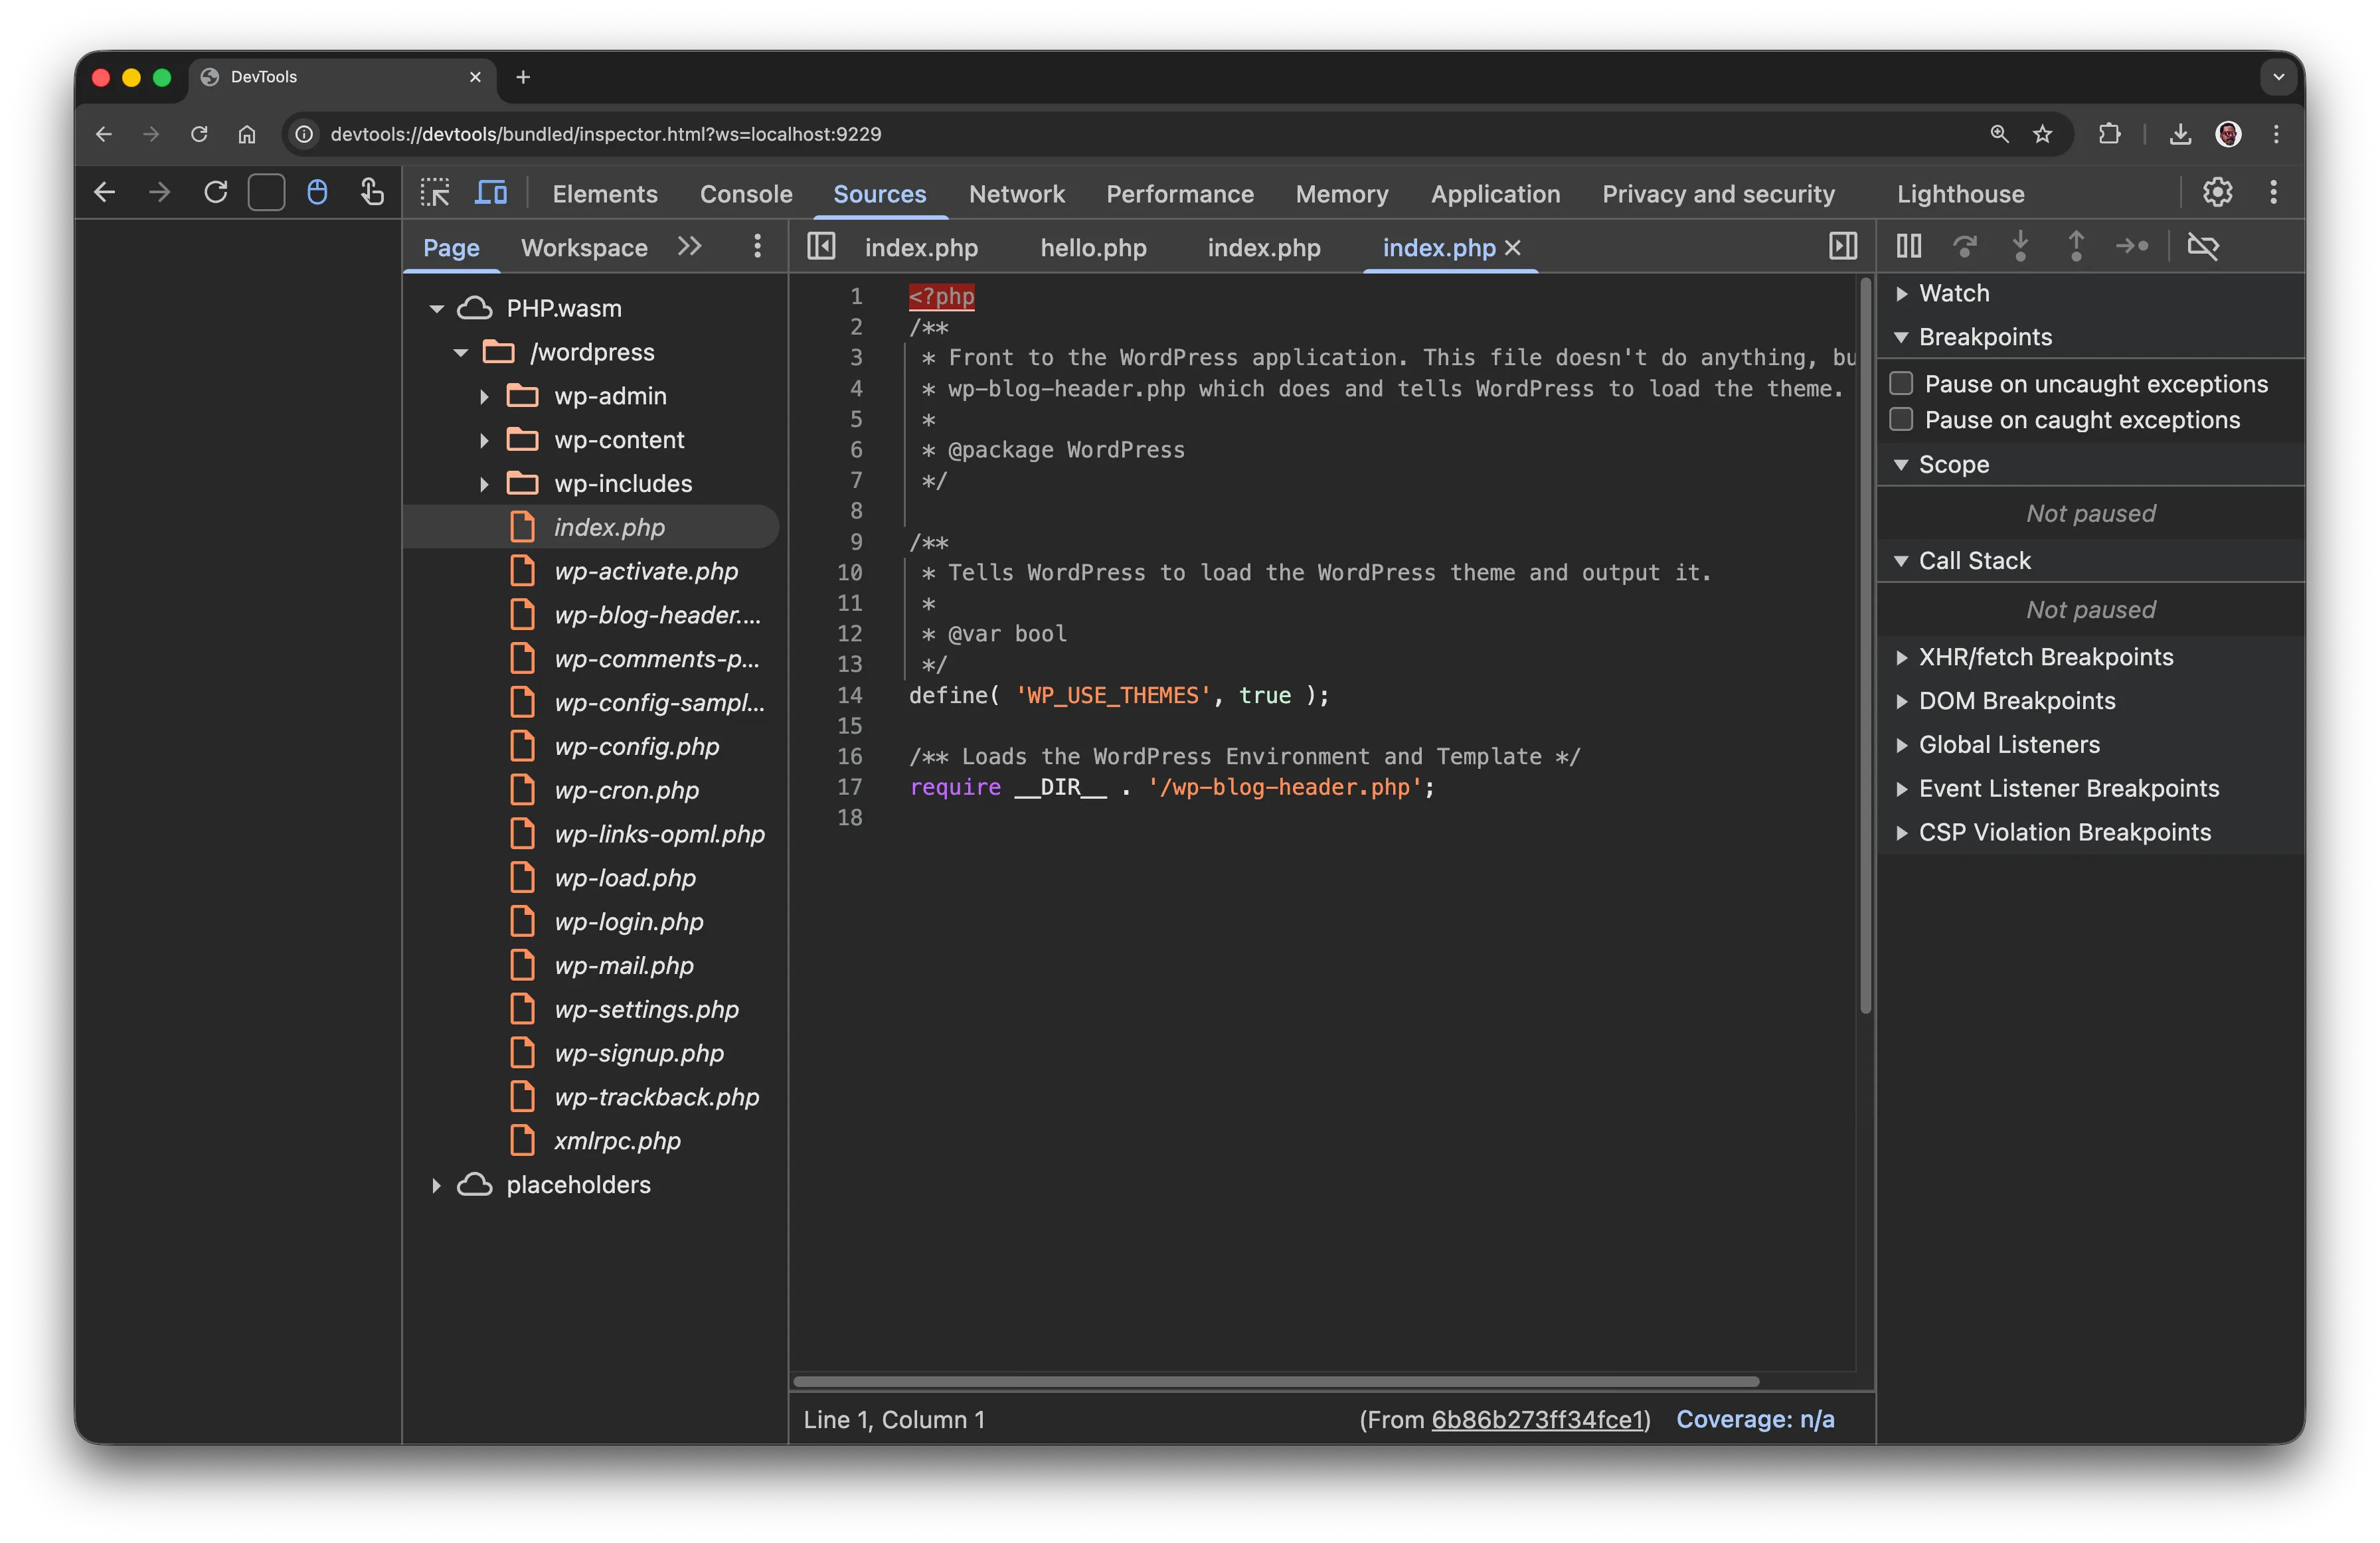
By clicking on the provided URL, for example, devtools://devtools/bundled/inspector.html?ws=127.0.0.1:9229, you can access DevTools connected to your application, with the ability to inspect all files of a WordPress instance.
For a more practical example, let's debug a plugin that has the following code:
<?php
/**
 * Plugin Name: Simple Admin Message
 * Description: Displays a simple message in the WordPress admin
 * Version: 1.0
 * Author: Playground Team
 */

// Prevent direct access
if (!defined('ABSPATH')) {
    exit;
}

// Display admin notice
function sam_display_admin_message() {
    $message = 'Hello! This is a simple admin message.';
    ?>
    <div class="notice notice-info is-dismissible">
        <p><?php _e($message, 'simple-admin-message'); ?></p>
    </div>
    <?php
}
add_action('admin_notices', 'sam_display_admin_message');
In the folder where the plugin is located, let's run the command in our terminal:
npx @wp-playground/cli@latest server --xdebug --experimental-devtools --auto-mount
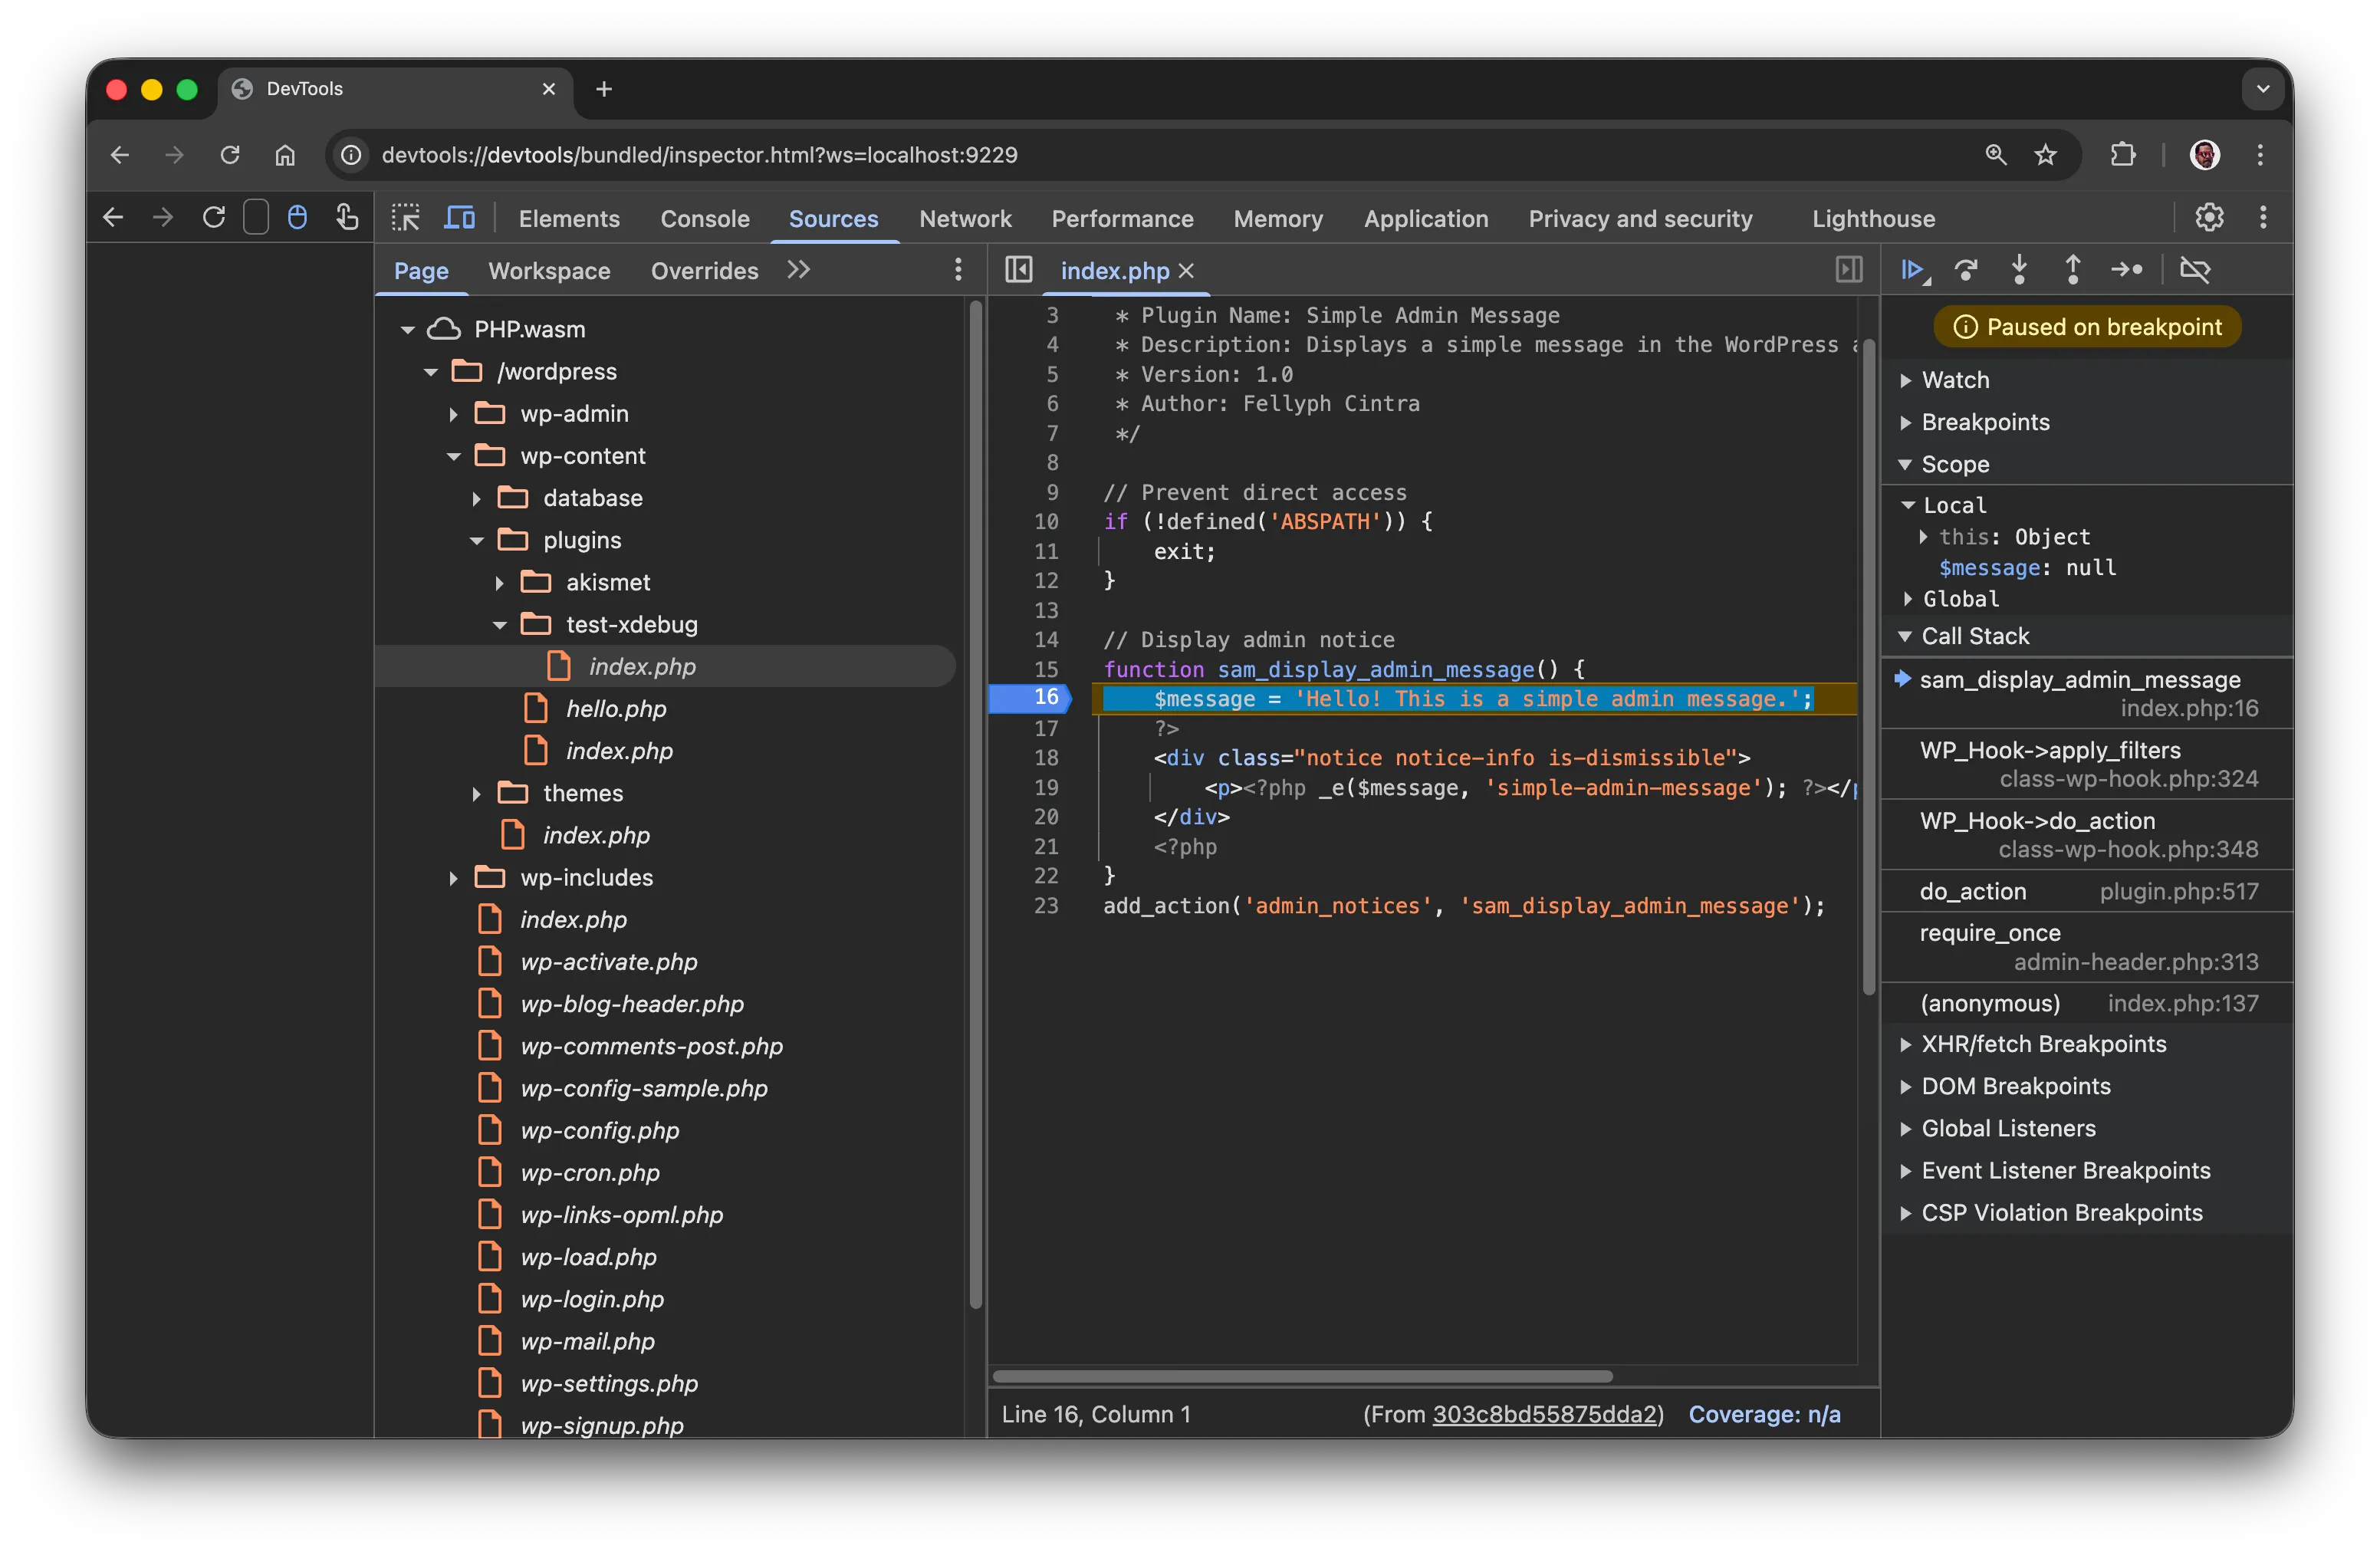
The Playground CLI(@wp-playground/cli) will automatically detect the plugin folder and mount it. Opening the project in your browser and DevTools, you'll be able to add breakpoints in your plugin's code and test it line by line.
This feature is in experimental mode. Until it's finished, we'll need your feedback. Please connect with us in the #playground Slack channel and share your thoughts.