Troubleshoot and debug Blueprints
When you build Blueprints, you might run into issues. Here are tips and tools to help you debug them:
Review Common gotchas
- Require
wp-load: to run a WordPress PHP function using therunPHPstep, you’d need to require wp-load.php. So, the value of thecodekey should start with"<?php require_once('wordpress/wp-load.php'); REST_OF_YOUR_CODE".
Common Issues and Solutions
Invalid Blueprint After Opening a Link
If Playground reports Invalid blueprint, read the detailed error message. It includes the underlying JSON parsing error when one is available.
If the message says the input still contains %XX escapes after decoding, the URL fragment was likely double-encoded. Rebuild the link from the original Blueprint object and encode it once with encodeURIComponent(JSON.stringify(blueprint)), or use Base64. Do not encode a fragment that is already encoded.
WP-CLI: Error Establishing a Database Connection on Mounted Sites
When using wp-cli with a mounted Playground site (e.g., via --mount-before-install), you might encounter an "Error establishing a database connection." This happens because WordPress Playground loads the SQLite database integration plugin from its internal files by default, not from the mounted directory, meaning it's not persisted for external wp-cli calls.
To resolve this, you need to explicitly install and configure the SQLite database integration plugin within your Blueprint.
Solution: Add the following steps to your Blueprint:
{
	"plugins": ["sqlite-database-integration"]
}
Example Usage:
To test this locally, combine the Blueprint with your Playground CLI command:
mkdir wordpress
# Ensure your blueprint with the above steps is saved as, for example, './blueprint.json'
npx @wp-playground/cli server --mount-before-install=wordpress:/wordpress --blueprint=./blueprint.json
cd wordpress
wp post list
This will ensure the SQLite plugin is installed correctly and configured within your mounted WordPress site, allowing wp-cli commands to function correctly.
Blueprints Builder
You can use an in-browser Blueprints editor to build, validate, and preview your Blueprints in the browser.
The editor is under development and the embedded Playground sometimes fails to load. To get around it, refresh the page. We're aware of that, and are working to improve the experience.
Check for the Filesystem and Database
Some blueprint steps (such as writeFile) alter the internal Filesystem structure of the Playground instance and some others (such as runSql) alter the internal WordPress database.
To check the final internal filesystem structure and database (after the blueprint steps have been applied) we can leverage some WordPress plugins that provide a SQL manager and a file explorer such as SQL Buddy and WPide (you can see them in action from https://playground.wordpress.net/?plugin=sql-buddy&plugin=wpide)
There are a bunch of methods we can launch from the console of any WordPress Playground instance to inspect the internals of that instance. They're exposed as part of window.playground object (see Developers > JavaScript API > Debugging and testing). Some examples:
> await playground.isDir("/wordpress/wp-content/plugins")
true
> await playground.listFiles("/wordpress/wp-content/plugins")
(3) ['hello.php', 'index.php', 'WordPress-Importer-master']
Full list of methods we can use is available here
Check for errors in the browser console
If your Blueprint isn’t running as expected, open the browser developer tools to check for any errors.
To open the developer tools in Chrome, Firefox, Safari*, and Edge: press Ctrl + Shift + I on Windows/Linux or Cmd + Option + I on macOS.
If you haven't yet, enable the Develop menu: go to Safari > Settings... > Advanced and check Show features for web developers.
The developer tools window allows you to inspect network requests, view console logs, debug JavaScript, and examine the DOM and CSS styles applied to your webpage. This is crucial for diagnosing and fixing issues with Blueprints.
Log your own error messages
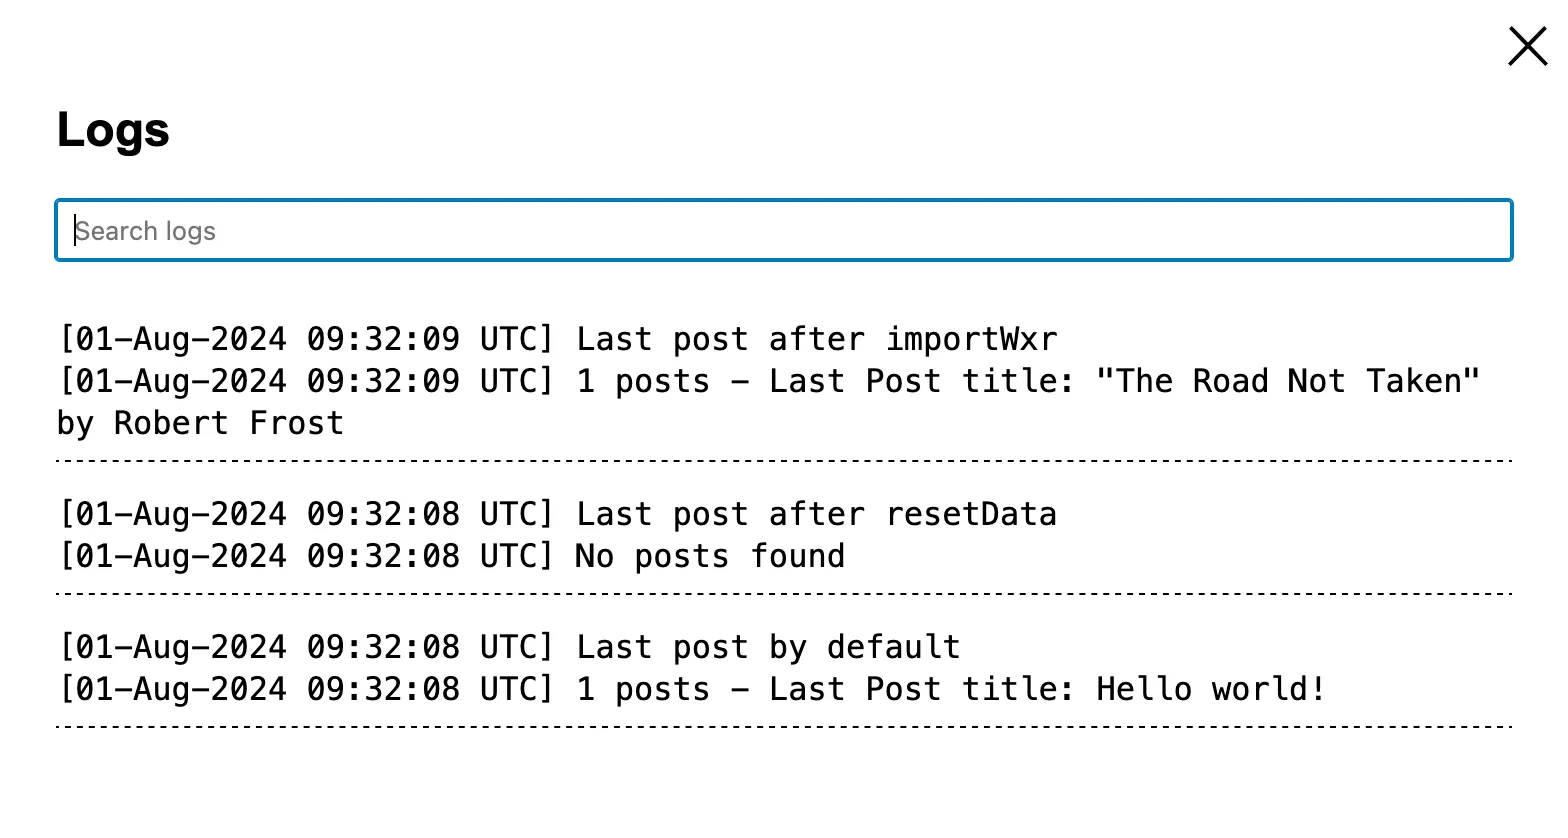
You can error_log your own error messages through runPHP step (see blueprint example and live demo) and check them from the "View Logs" option or from the browser's console.

When you download your Playground instance as a zip through the "Download as zip" option you'll also download the debug.log file containing all the logs from your Playground instance.
Ask for help
The community is here to help! If you have questions or comments, open a new issue in this repository. Remember to include the following details:
- The Blueprint you’re trying to run.
- The error message you’re seeing, if any.
- The full output from the browser developer tools.
- Any other relevant information that might help us understand the issue: OS, browser version, etc.