Solucionar problemas y depurar Blueprints
Los errores de Blueprint suelen apuntar a uno de estos tres lugares:
- El JSON del Blueprint no es válido.
- Playground no pudo obtener el Blueprint o uno de sus recursos.
- Una etapa del Blueprint se ejecutó, pero falló WordPress, PHP, WP-CLI o un plugin.
Empieza con el nombre exacto del error que muestra Playground y usa la sección correspondiente a continuación.
Lista de verificación rápida
- Pega el Blueprint en el editor de Blueprints para validar el esquema JSON.
- Si el Blueprint se carga desde una URL, abre esa URL directamente en una ventana privada del navegador y confirma que descarga JSON válido o un paquete ZIP de Blueprint.
- Si falla una etapa, anota el número de etapa en
BlueprintStepExecutionError. La etapa fallida suele ser el elemento en esa posición después de que se hayan expandido los atajos de Blueprint. - Abre las herramientas de desarrollo del navegador y revisa las pestañas Console y Network para ver detalles de descarga, CORS, PHP o activación de plugins.
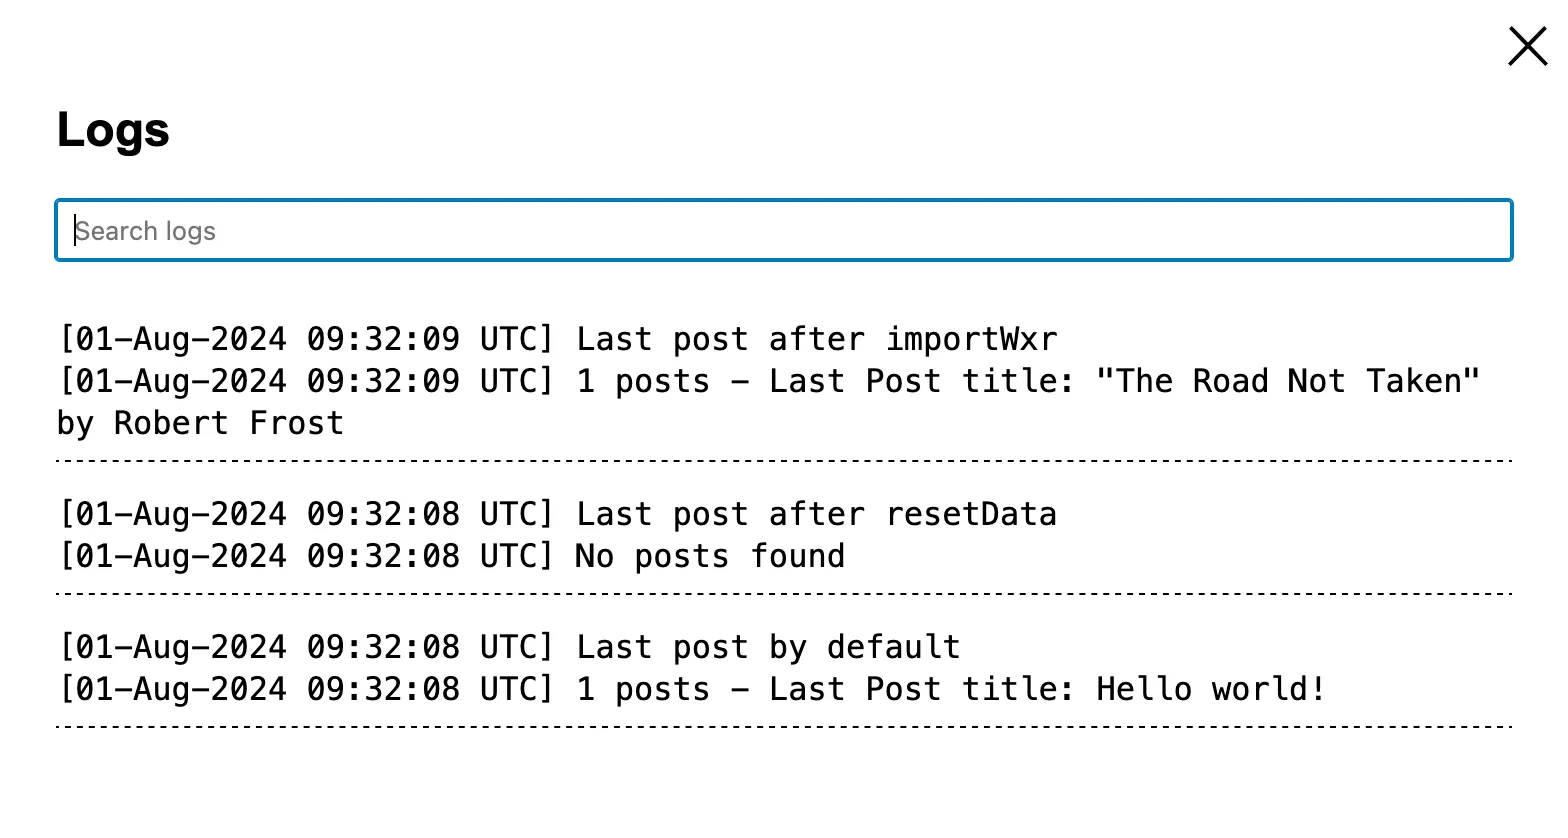
- Para fallas de activación de plugin/tema, revisa el panel Logs de Playground o la consola del navegador para ver advertencias y errores fatales de PHP.
InvalidBlueprintError
InvalidBlueprintError significa que el Blueprint no coincide con el
formato de datos de Blueprint. La salida del error
suele contener rutas como /steps/2/pluginData o /preferredVersions.
Propiedad inesperada activate
activate debe estar dentro de options, no directamente en la etapa ni dentro
de pluginData.
{
	"step": "installPlugin",
	"pluginData": {
		"resource": "wordpress.org/plugins",
		"slug": "woocommerce"
	},
	"options": {
		"activate": true
	}
}
Propiedad inesperada plugins en preferredVersions
preferredVersions solo acepta php y wp. Instala plugins con el atajo
plugins de nivel superior o con una etapa explícita installPlugin.
{
	"preferredVersions": {
		"php": "8.3",
		"wp": "latest"
	},
	"plugins": ["sqlite-database-integration"]
}
Falta slug, url, path o files
El objeto de recurso está incompleto o usa la forma incorrecta. Correcciones comunes:
- Plugin de WordPress.org:
{ "resource": "wordpress.org/plugins", "slug": "akismet" } - URL de ZIP:
{ "resource": "url", "url": "https://example.com/plugin.zip" } - Directorio Git:
{ "resource": "git:directory", "url": "https://github.com/org/repo", "ref": "trunk", "refType": "branch" }
Consulta Referencias de recursos para ver todas las formas de recurso compatibles.
Propiedades mixtas de instalación de plugin
Usa pluginData para installPlugin. No proporciones pluginData junto con
ejemplos antiguos u objetos personalizados como pluginZipFile.
El recurso de plugin de WordPress.org también necesita un slug separado:
{
	"step": "installPlugin",
	"pluginData": {
		"resource": "wordpress.org/plugins",
		"slug": "woocommerce"
	}
}
No escribas "resource": "wordpress.org/plugins/woocommerce".
BlueprintFetchError
BlueprintFetchError significa que Playground no pudo cargar el archivo pasado
a ?blueprint-url=.
Comprueba que la URL:
- Sea pública y no requiera cookies, inicio de sesión, una sesión temporal o una VPN.
- Devuelva HTTP 200 al abrirse directamente.
- Sirva JSON válido o un paquete ZIP con
blueprint.jsondentro. - Envíe
Access-Control-Allow-Origin: *u otro encabezado que permitahttps://playground.wordpress.net. - Use una URL de archivo sin procesar, no una página HTML de repositorio.
Para GitHub, usa URL de raw.githubusercontent.com en lugar de github.com/.../blob/....
Para GitLab, usa la URL del archivo sin procesar en lugar de una página /-/blob/.
# Good
https://raw.githubusercontent.com/WordPress/blueprints/trunk/blueprints/welcome/blueprint.json

# Not a raw JSON response
https://github.com/WordPress/blueprints/blob/trunk/blueprints/welcome/blueprint.json
Las URL temporales de túnel, las URL de desarrollo local y los assets de release en borrador suelen fallar porque el navegador no puede acceder a ellos o porque no permiten solicitudes de origen cruzado. Mueve el Blueprint a un alojamiento público con CORS activado.
El archivo de Blueprint no es JSON válido ni un archivo ZIP
Esto significa que Playground recibió una respuesta, pero la respuesta no era un Blueprint. La URL puede haber devuelto una página HTML, una página 404, un visor de archivo de repositorio, una advertencia de proxy, una página de inicio de sesión o un ZIP corrupto.
Abre la URL directamente y comprueba que:
- Las URL JSON devuelvan JSON de Blueprint válido.
- Las URL de paquete ZIP descarguen un archivo ZIP real.
- Los paquetes de Blueprint contengan
blueprint.jsonen la raíz del ZIP. - La respuesta no sea una pequeña página HTML o de texto de error.
URIError: URI malformed
URIError: URI malformed suele indicar un fragmento de Blueprint codificado
incorrectamente en la URL, no una etapa de Blueprint fallida. Revisa escapes
% inválidos, fragmentos codificados dos veces o JSON sin procesar pegado
después de #. Reconstruye el enlace desde el Blueprint original y codifícalo
una vez, o usa Base64. Consulta
Fragmentos de Blueprint codificados.
ResourceDownloadError
ResourceDownloadError significa que el Blueprint cargó, pero una etapa no
pudo descargar un recurso como un ZIP de plugin, ZIP de tema, archivo WXR o
archivo de sitio importado.
Confirma que la URL del recurso:
- Descarga el archivo real, no una página HTML, advertencia de redirección o artifact expirado.
- Es pública y no requiere autenticación.
- Permite solicitudes de origen cruzado.
- Es la URL directa del archivo. Algunas páginas de release y páginas de artifacts de CI son páginas para personas, no descargas directas.
- Todavía existe. Los enlaces temporales y los artifacts de CI pueden expirar.
Para código fuente en un repositorio Git, prefiere un
recurso git:directory.
Usa un recurso url para artifacts ZIP ya creados que estén disponibles
públicamente para descarga.
BlueprintStepExecutionError
BlueprintStepExecutionError significa que una etapa específica falló después
de que el Blueprint empezó a ejecutarse. El mensaje incluye un número de etapa:
BlueprintStepExecutionError: Error when executing the blueprint step #4
Usa ese número para inspeccionar la etapa correspondiente. Si tu Blueprint usa
atajos como plugins, login, siteOptions o constants, Playground los
expande en etapas antes de ejecutar el Blueprint. Usa steps explícitas cuando
el orden importe.
Los parámetros de consulta de URL como ?plugin=..., ?theme=..., ?php=...,
?wp=... y ?networking=yes también crean un Blueprint implícito. Los errores
de esas URL siguen siendo errores de ejecución de Blueprint, y las etapas
generadas afectan al número de etapa informado.
PHP.run() failed with exit code 255
El código de salida 255 suele significar que PHP encontró un error fatal.
Busca la primera línea Fatal error, Uncaught o TypeError en la salida. La
gran página HTML de error que la rodea suele ser la pantalla genérica de error
crítico de WordPress.
Para hacer que la salida sea más útil durante la depuración, activa las constantes de depuración de WordPress cerca del inicio del Blueprint:
{
	"step": "defineWpConfigConsts",
	"consts": {
		"WP_DEBUG": true,
		"WP_DEBUG_LOG": true,
		"WP_DEBUG_DISPLAY": true,
		"WP_DISABLE_FATAL_ERROR_HANDLER": true
	}
}
Después vuelve a ejecutar el Blueprint y revisa el panel Logs de Playground o la consola del navegador.
PHP.run() failed with exit code 1
El código de salida 1 aparece a menudo cuando WP-CLI o WordPress devuelve un
error de aplicación. Lee primero la sección Stderr. Normalmente indica el
argumento no compatible, el recurso faltante o la falla específica del comando.
Algunos comandos WP-CLI se comportan de forma diferente en Playground porque WordPress se ejecuta en WebAssembly con SQLite. Mantén los comandos pequeños y pruébalos individualmente antes de añadir una cadena larga a un Blueprint.
Undefined constant ABSPATH
Esto suele ocurrir en una etapa runPHP que llama a API de WordPress sin
cargar primero WordPress.
Añade wp-load.php antes de cualquier función, constante, opción o API de
plugin de WordPress:
{
	"step": "runPHP",
	"code": "<?php require '/wordpress/wp-load.php'; update_option('blogname', 'Demo site');"
}
Plugin could not be activated
Los errores de activación de plugins suelen venir del propio plugin, no del ejecutor de Blueprints. Causas comunes:
- El plugin requiere una versión más reciente de PHP o WordPress.
- El plugin tiene un error fatal durante la activación.
- El plugin depende de otro plugin que no está instalado o activado.
- El plugin realiza una redirección o imprime una salida inesperada durante la activación.
- El ZIP del plugin se extrae a una carpeta o archivo principal con un nombre distinto de la ruta que la etapa está activando.
Si el error dice que la versión actual de PHP o WordPress no cumple los
requisitos mínimos, define preferredVersions:
{
	"preferredVersions": {
		"php": "8.3",
		"wp": "latest"
	}
}
WordPress exited with exit code 0
La activación puede fallar aunque WordPress salga con código 0. Esto suele
significar que WordPress devolvió una respuesta de error de activación en lugar
de una caída del proceso PHP. Cuando el mensaje diga Inspect the "debug" logs,
revisa el panel Logs de Playground, la consola del navegador o la salida de
la CLI.
Busca advertencias de PHP, redirecciones o salida impresa durante la activación, plugins de dependencia ausentes o requisitos mínimos de PHP/WordPress del plugin.
Current PHP or WordPress version does not meet minimum requirements
Los errores de incompatibilidad de versión suelen incluir texto como:
Current PHP version (7.4.33) does not meet minimum requirements. The plugin requires PHP 8.0.
o:
Current WordPress version (6.9.4) does not meet minimum requirements. The plugin requires WordPress 7.0.
Define preferredVersions con una versión compatible de PHP y WordPress, o usa
una release del plugin/tema que sea compatible con las versiones disponibles en
Playground.
Si el error es:
Failed to download WordPress 6.9.0 (HTTP 404)
la compilación de WordPress solicitada no está disponible. Usa latest, una
versión publicada compatible o un valor beta/nightly compatible.
Si el error dice Plugin file does not exist, inspecciona el nombre de la
carpeta instalada. Para URL ZIP con nombres de carpeta inusuales, define
targetFolderName:
{
	"step": "installPlugin",
	"pluginData": {
		"resource": "url",
		"url": "https://example.com/my-plugin.zip"
	},
	"options": {
		"activate": true,
		"targetFolderName": "my-plugin"
	}
}
Si el plugin tiene dependencias, instala y activa esas dependencias primero con etapas explícitas.
Theme could not be activated
Las fallas de activación de temas suelen significar que el nombre de la carpeta del tema es incorrecto, que el ZIP del tema se extrajo a un directorio inesperado o que el código del tema causó un error de WordPress/PHP.
Usa installTheme con options.activate al instalar un tema:
{
	"step": "installTheme",
	"themeData": {
		"resource": "wordpress.org/themes",
		"slug": "twentytwentyfour"
	},
	"options": {
		"activate": true
	}
}
Si usas una etapa independiente activateTheme, pasa el nombre de la carpeta
dentro de wp-content/themes, no una URL completa ni el nombre del archivo ZIP.
Could not write to a file
Errores como este significan que el directorio padre no existe:
Could not write to "/wordpress/wp-content/plugins/example/index.php":
There is no such file or directory OR the parent directory does not exist.
Crea primero el directorio con mkdir o usa writeFiles con un recurso
literal:directory.
[
	{
		"step": "mkdir",
		"path": "/wordpress/wp-content/plugins/example"
	},
	{
		"step": "writeFile",
		"path": "/wordpress/wp-content/plugins/example/index.php",
		"data": "<?php /* Plugin Name: Example */"
	}
]
Could not unzip file
Esto suele significar que el archivo no es un archivo ZIP válido. La URL puede haber devuelto una página HTML, una respuesta de error, una página de inicio de sesión o un archivo truncado.
Si la salida dice Could not unzip file. Error code: 19, verifica que la
descarga sea un archivo ZIP. Un tamaño de archivo pequeño a menudo significa que
el servidor devolvió una página HTML de error en lugar del archivo.
Abre la URL directamente y confirma que el navegador descarga un ZIP. Si estás usando un artifact de GitHub o de CI, usa una URL de descarga directa y asegúrate de que la release o el artifact sea público.
Problemas comunes con comandos WP-CLI
La etapa wp-cli ejecuta WP-CLI dentro de Playground. Es útil para tareas de
configuración, pero no todos los comandos o características del shell se
comportan como en una terminal local.
Correcciones comunes:
- Usa el nombre de etapa
"wp-cli", no"wpcli"ni"cli". - Mantén los comandos enfocados. Prefiere varias etapas
wp-clien lugar de un comando de shell complejo. - Evita sustituciones de shell como
$(...)en Blueprints compartidos. UsarunPHPpara lógica que necesite API de WordPress. - Revisa los nombres de parámetros contra el comando WP-CLI que estás usando. Por ejemplo, los parámetros específicos de cada comando pueden diferir entre
wp post list,wp post deletey comandos proporcionados por plugins. - Si un comando WP-CLI proporcionado por un plugin falla con un stack trace del plugin, la corrección suele estar en ese plugin o en los datos de entrada pasados al comando.
- Si un comando falla con
unknown --post_type parameterounknown --format parameter, revisa si las flags pertenecen a otro comando en el pipeline. - Si un comando de plugin falla con
Unsupported argument type passed to WP_CLI::error_to_string(): 'NULL', confirma que el plugin esté activo, que los datos importados existan y que la entrada del comando apunte a un recurso válido.
WP-CLI: Error establishing a database connection en sitios montados
Al usar wp-cli con un sitio Playground montado, por ejemplo mediante
--mount-before-install, podrías encontrar "Error establishing a database
connection." Esto ocurre porque WordPress Playground carga el plugin de
integración de base de datos SQLite desde sus archivos internos por defecto, no
desde el directorio montado.
Añade explícitamente el plugin de integración SQLite al sitio WordPress montado:
{
	"preferredVersions": {
		"php": "8.3",
		"wp": "latest"
	},
	"plugins": ["sqlite-database-integration"],
	"steps": [
		{
			"step": "login",
			"username": "admin"
		}
	]
}
Después ejecuta el Blueprint con el sitio montado:
mkdir wordpress
npx @wp-playground/cli server --mount-before-install=wordpress:/wordpress --blueprint=./blueprint.json
Herramientas de depuración
Editor de Blueprints
Usa el editor de Blueprints en el navegador para crear, validar y previsualizar Blueprints.
Precaución
El editor está en desarrollo y el Playground incrustado a veces falla al cargar. Para evitarlo, actualiza la página.
Inspección del sistema de archivos y la base de datos
Algunas etapas de Blueprint, como writeFile, modifican
el sistema de archivos interno. Otras, como runSql,
modifican la base de datos.
Para inspeccionar el estado final, instala plugins como
SQL Buddy y
WPide. Puedes verlos en acción en
https://playground.wordpress.net/?plugin=sql-buddy&plugin=wpide.
También puedes inspeccionar una instancia de Playground desde la consola del
navegador mediante window.playground:
await playground.isDir('/wordpress/wp-content/plugins');
await playground.listFiles('/wordpress/wp-content/plugins');
Consulta la API PlaygroundClient completa.
Consola del navegador y solicitudes de red
Abre las herramientas de desarrollo del navegador para revisar errores de
JavaScript, logs de depuración de PHP y solicitudes de red fallidas. En Chrome,
Firefox y Edge, presiona Ctrl + Shift + I en Windows/Linux o
Cmd + Option + I en macOS.
Safari
Si no has activado el menú Develop, ve a Safari > Settings... > Advanced y marca Show features for web developers.
Registro de errores personalizado
Puedes escribir tus propios mensajes con error_log() en una etapa
runPHP y luego revisar el panel Logs de Playground o
la consola del navegador.
Cuando descargas tu instancia de Playground como ZIP mediante la opción
"Download as zip", el archivo también incluye debug.log.
Pedir ayuda
Si necesitas ayuda, abre un issue e incluye:
- El JSON del Blueprint o la URL pública del Blueprint.
- El mensaje de error exacto.
- El número de etapa fallida, si se muestra.
- Navegador, sistema operativo y si usaste el sitio web, la API JavaScript o la CLI.
- Salida relevante de consola, red o CLI.